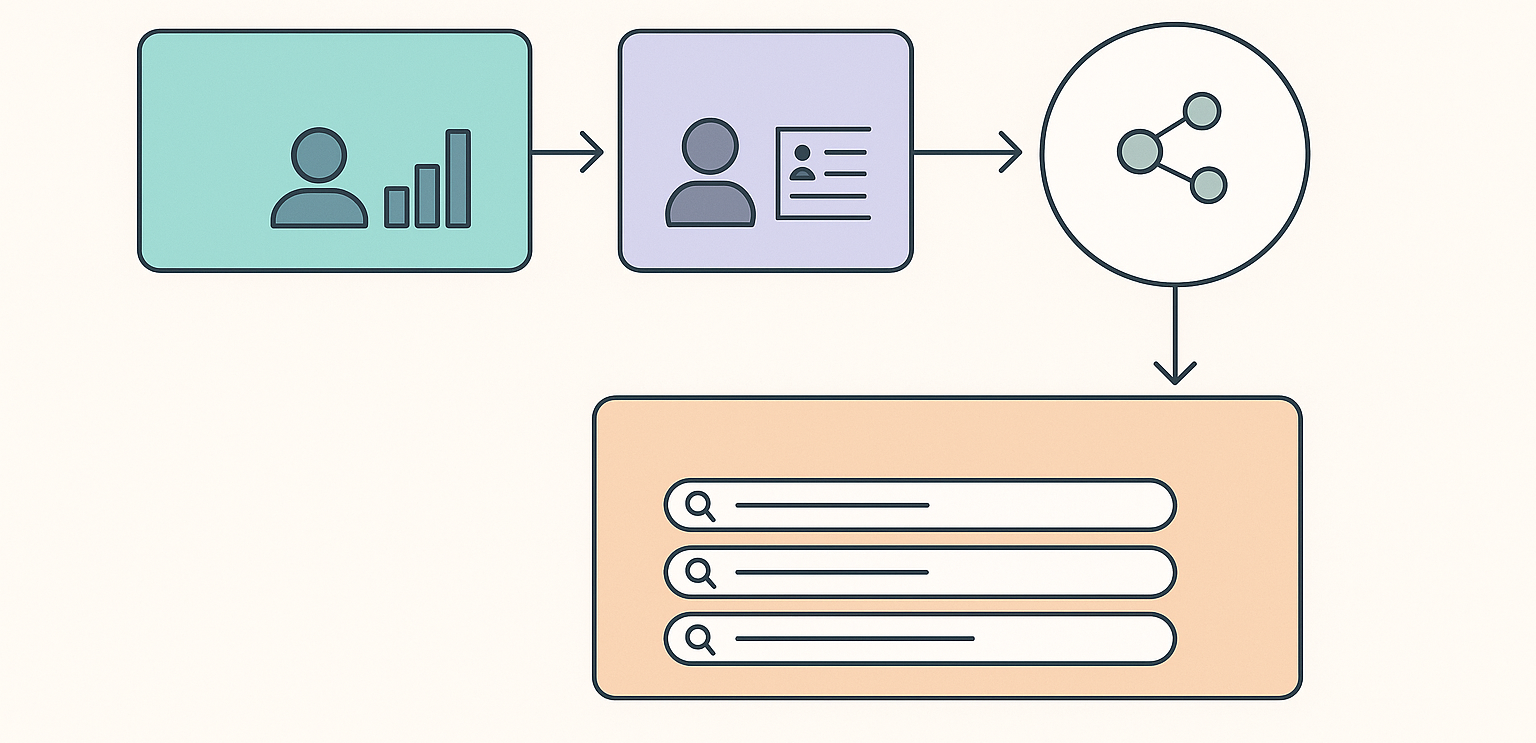
Enhancing Query Recommendations Through User Behavior Analysis: The objective of my master thesis is to re-implement the ideas from the paper "Knowledge-Augmented Large Language Models for Personalized Contextual Query Suggestion"
and extend them by integrating ORCID profiles and user attributes (profession, nationality, personal interests)
into the entity-centric knowledge store.

This project focuses on analyzing and forecasting daily wind power generation in Germany between 2017 and 2019.
The goal is to build a complete time series forecasting pipeline and predict wind energy production for December 2019 using different statistical models.

This project focuses on building and evaluating an implicit-feedback recommender system for music listening data using a reduced subset of the Last.fm 1K dataset.
The goal is to re-implement Implicit ALS (Hu, Koren & Volinsky, 2008), benchmark it against Popularity and Item–Item Collaborative Filtering baselines, and assess performance under different confidence functions and hyperparameter settings.

This project focuses on analyzing videogame ratings released between 1998 and 2021 by comparing critic scores (Metascore) and player ratings (Userscore) across genres, platforms, and time.
The goal is to perform data cleaning, exploratory analysis, visual comparisons and train classification models to predict overall game quality (Good/Average/Bad) and player-perceived success using Metascore as a predictor.

This project focuses on cleaning and exploring a real-world corporate layoffs dataset (mainly tech/startups) using MySQL.
The goal is to build a structured SQL pipeline—starting from a raw CSV import, creating staging tables, removing duplicates, standardizing strings and dates, handling null values—and then run EDA queries to identify the most impacted companies, industries, and countries, as well as layoff trends over time.

This project focuses on building a simple Tableau dashboard for Airbnb data, analyzing booking trends and pricing patterns.
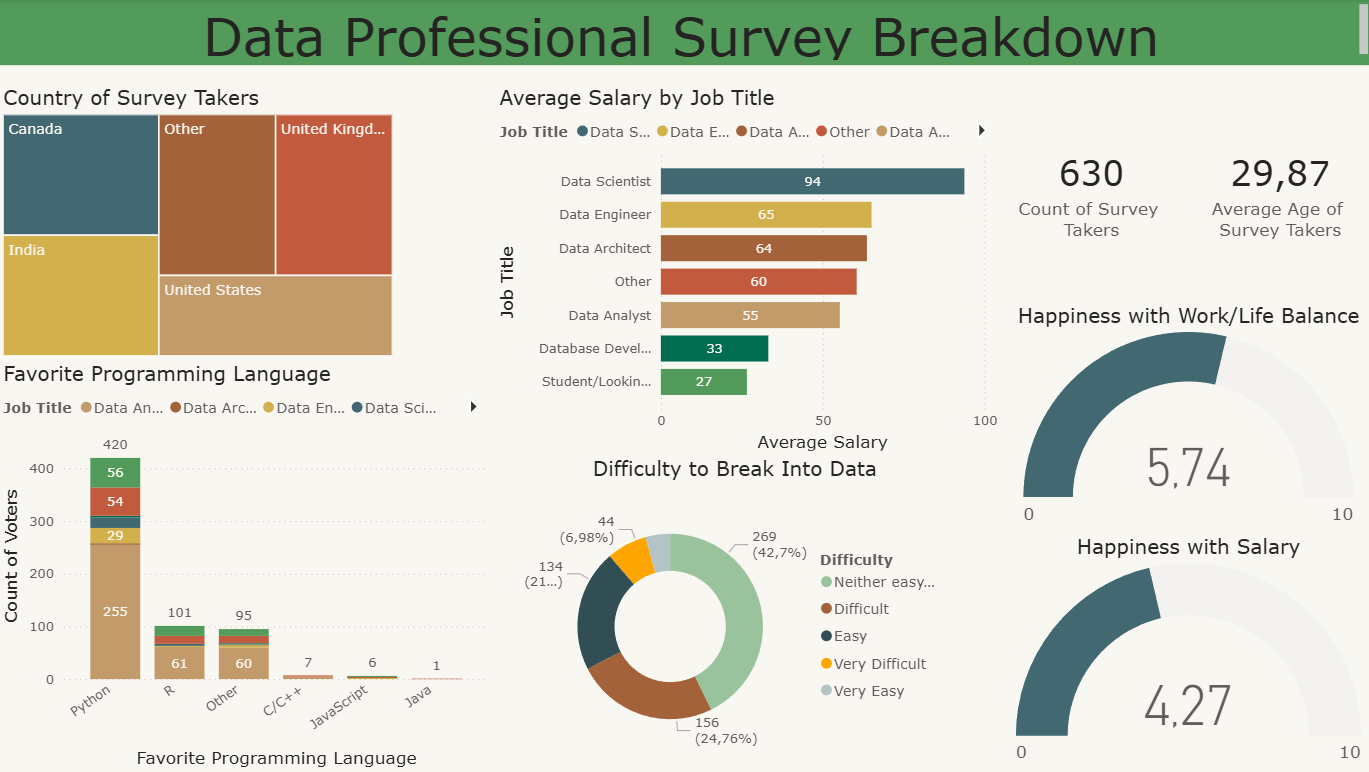
This project focuses on building a Power BI dashboard to analyze a survey of data professionals.
The goal is to summarize key KPIs and trends—respondent profile, average salary by role, entry difficulty, satisfaction, and most-used languages—through interactive visuals.